ElectronDisplay.jl is a package that provides a simple UI based on Electron for displaying plots and tabular data. It works with most plotting packages and almost all data structures that represent tabular data in the Julia ecosystem. The package is a core piece of the Queryverse.
Plot display
Anytime you load ElectronDisplay.jl via using ElectonDisplay, it automatically becomes the default display for you current Julia session. From that moment on, whenever you display a figure from any of the supported plotting packages, it will show up in a window that is managed by ElectronDisplay.jl. Any plotting package that hooks into the standard Julia multimedia I/O API will work with this setup, as long as it supports either the PNG or SVG format with its show method.
ElectronDisplay.jl provides more tightly integrated support for PlotlyJS.jl and VegaLite.jl: plots from both packages support a full range of interactive features inside the window that ElectronDisplay.jl opens for them.
Here is a simple example of how this works. Executing the following example code
julia> using VegaLite, VegaDatasets, ElectronDisplay

julia> dataset("cars") |> @vlplot(:point, x=:Acceleration, y=:Miles_per_Gallon, color=:Origin)
will open a window that displays this plot:
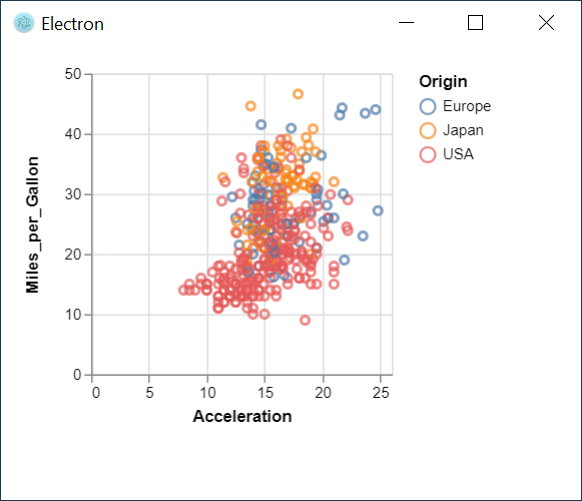
Table display
Thanks to tks’s fantastic recent contribution, ElectronDisplay.jl now also has support for showing tabular data in a grid. To display a table in that way, you simply pass it to the electrondisplay function, and it will show in a new window.
The following example demonstrates how easy it is to display a DataFrame:
julia> using DataFrames, ElectronDisplay

julia> df = DataFrame(a=rand(100), b=rand(100), c=rand(100));

julia> electrondisplay(df)
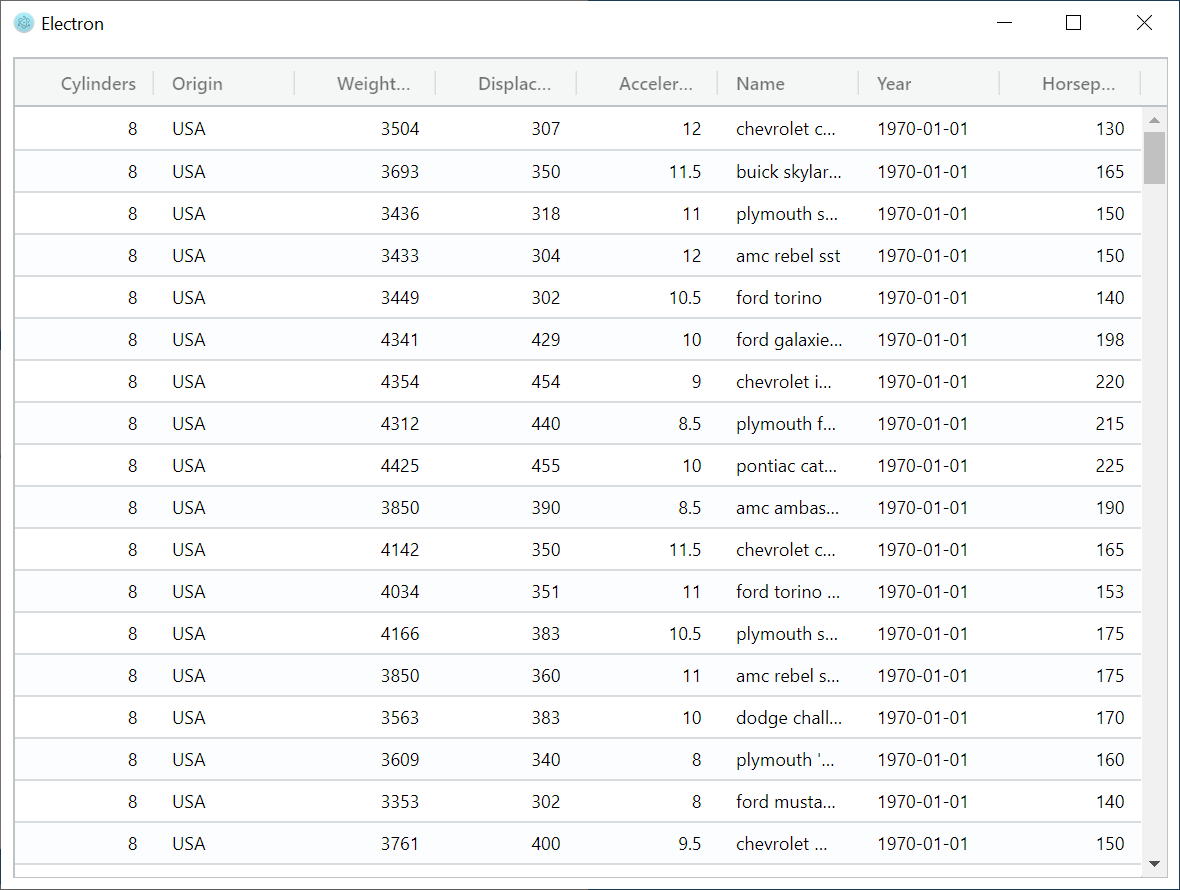
The table view works with almost any tabular source, not just DataFrames.jl. For example, here we are showing the result of a Query.jl query directly in the grid, without ever materializing it into a DataFrame:
julia> using VegaDatasets, Query, ElectronDisplay

julia> dataset("cars") |>
       @filter(_.Origin=="USA") |>
       @select(-:Miles_per_Gallon) |>
       electrondisplay
And the results are shown in a window like this:
The table display in ElectronDisplay.jl works for any source that either supports a show method for the application/vnd.dataresource+json MIME type, or implements the TableTraits.jl interface. Anything that iterates named tuples automatically is a TableTraits.jl source, so even packages that have never heard of either option might well work with ElectronDisplay.jl.
Summary
ElectronDisplay.jl is probably most useful for people that work directly in the Julia REPL and not in one of the more fully feature IDEs. It is also a very young package, and any help with the package would be most welcome! I have created a few issues with ideas for improvements, but I am sure there are many more. I think this could be a project where someone with web UI experience could really contribute significantly.