ElectronDisplay.jl is a package that provides a simple UI based on Electron for displaying plots and tabular data. It works with most plotting packages and almost all data structures that represent tabular data in the Julia ecosystem. The package is a core piece of the Queryverse.
What is new?
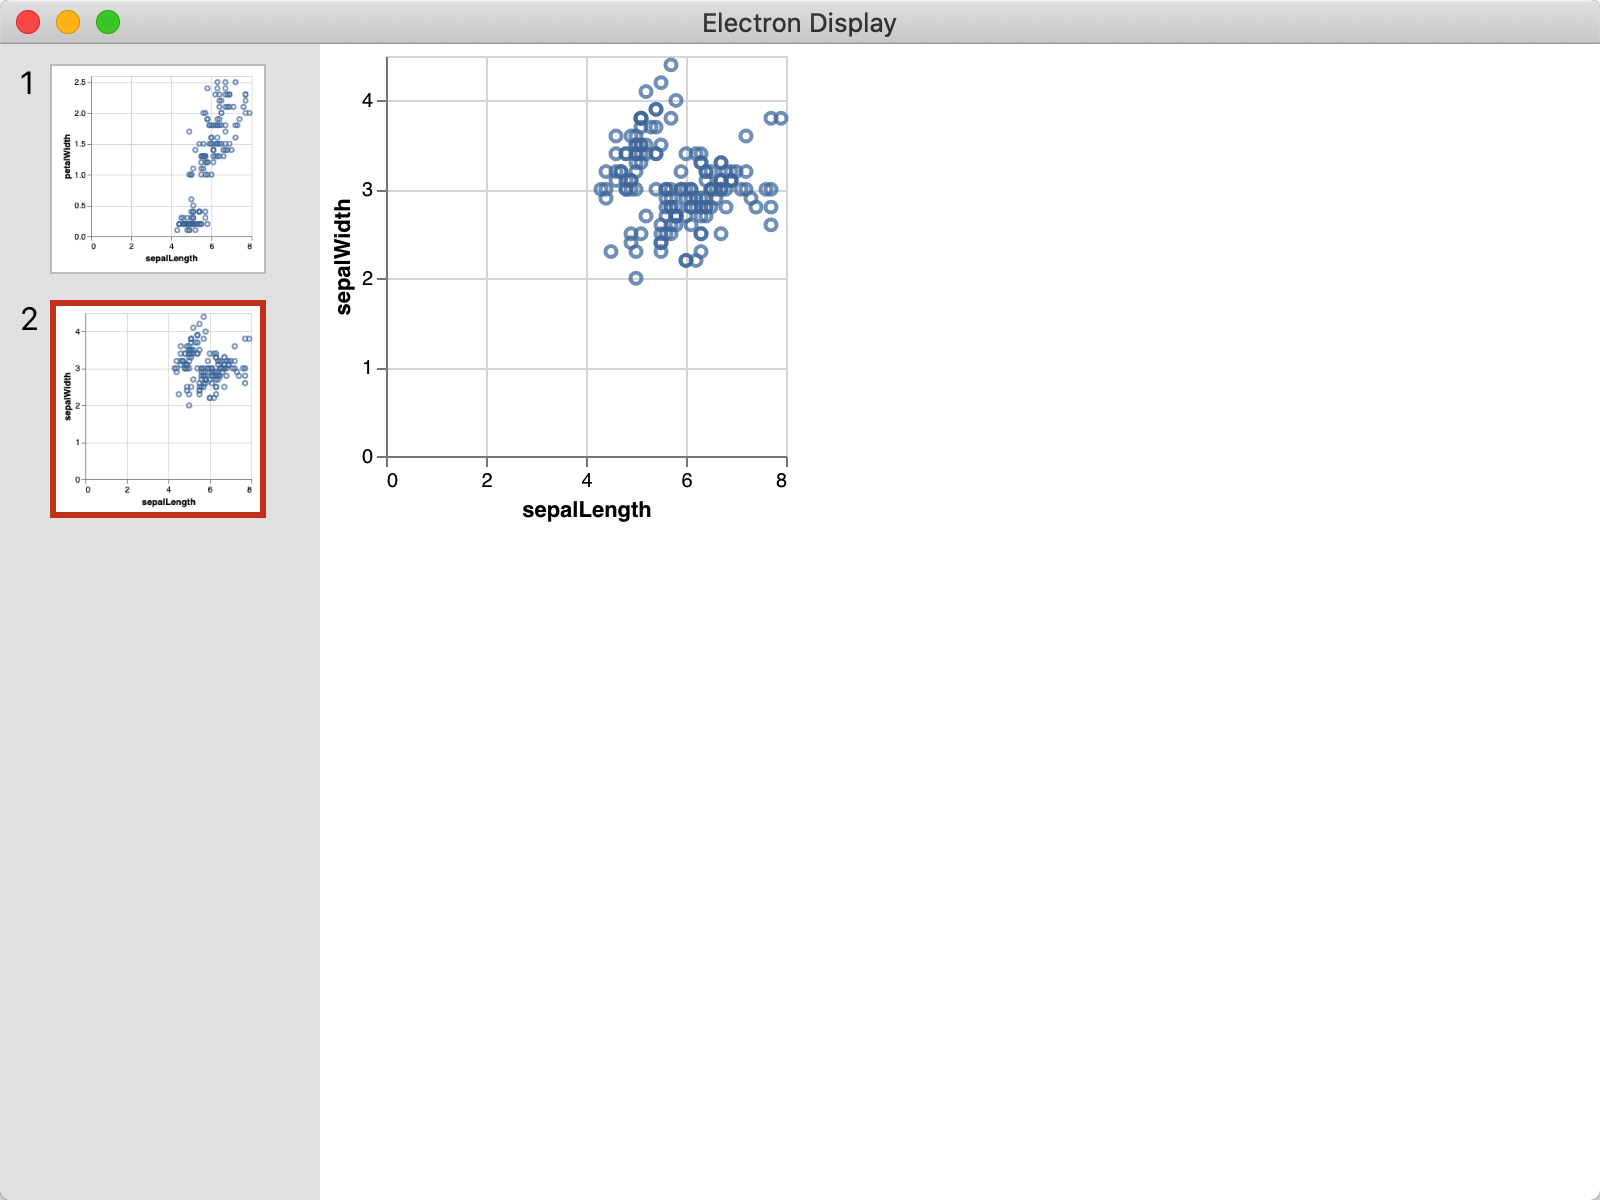
There are a bunch of bugfixes as well as some new features in v1.0.0. The main new feature is the plotgallery, an interactive plot display UI that is written in TypeScript and based on React. It supports displaying multiple plots in the same window simultaniously, even if those plots are created with different plotting packages. For example, you can display a Gadfly.jl figure and then plot a VegaLite.jl plot, or multiple VegaLite.jl plots, and they would show in a single window instead of opening a new window each time or replacing the old plots.
Some functionalities in detail
- Press CTRL + C on Windows and Linux or Command + C on macOS to copy the current figure to the system clipboard
- Press arrow keys to switch between plots quickly and delete/backspace to remove a graph
- Supports Vega, VegaLite, and several image formats (such as PNG, JPG, and SVG)
- Support viewport-sized plots that resize according to the window size
You can have a look at the detailed release notes here.
Contributions are welcomed
ElectronDisplay.jl is still a new package that needs help from the community to resolve the current issues that it has. In fact, as an apprentice of the Undergraduate Research Apprentice Program supervised by David Anthoff, I have been working on several issues on this project over the past few weeks after I made the initial pull request. If you are interested in making contributions to the project, you can have a look at Issues for ElectronDisplay.jl, or Issues for Plotgallery.